
We work on building network-reporting CO2 sensors for use in schools and public gathering places. The core idea is to use CO2 as proxy for Corona SARS-CoV2 viruses, as such we take great care in the design. In our validation we found a strange relationship between the measurement interval and the actual CO2 reading. We describe this in the hope to find a solution or some advise.
Hardware
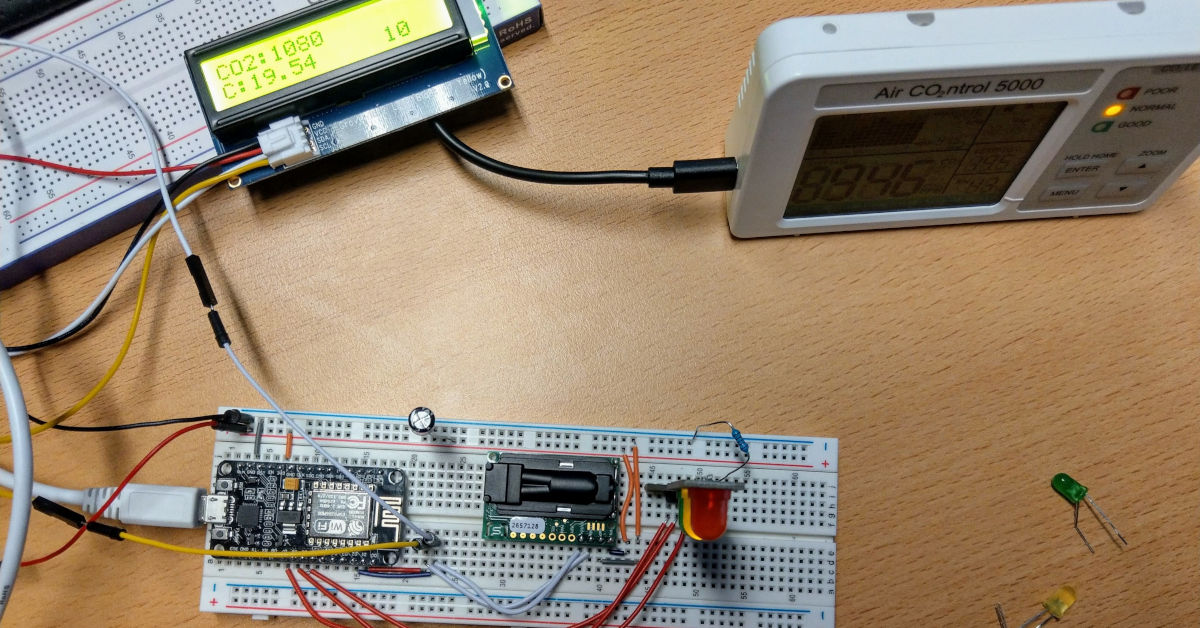
The Sensirion SCD30 was placed inside an IoT „home grown“ experimental setting primarily consisting of a NodeMCU Amica assembly with ESP 8266, some „traffic light“ LEDs plus a small display. Everything is run at 3.3 volts. The device used for comparison was an off-the shelf, non-professional CO2 meter called „TFA AirCo2ntrol 5000„. Both were carefully calibrated to fresh air at 400ppm at the same time under the same gas, standing together in close proximity. The same physical layout was used during the whole experiment which lasted a couple of days.
Software
We use the SprakFun SCD30 CO2 Sensor library and custom-created software which was inspired and build on top of the „CO2-Ampel“ project by the IoT Werkstatt of Hochschule Trier. Its source code is available on github (link to exactly the version that was used to run this experiment).
Experiment setup
The experiment was carried out in an unoccupied office space. There was a „fresh air phase“ where the room was very well ventilated by opening windows. In later stages, windows were closed and CO2 from the surrounding spaces were permitted to difuse into the room (door was closed, so diffusion was relatively slow). Direct airflow toward the sensors was prevented. Especially the unhoused SCD30 reacts very sensitive to airflow and provides incorrect readings if exposed to it. Thus we ensured no such problem existed. The experimental setup with the SCD30 was programmed to measure in intervals of 2, 3, and 5 seconds. Each interval was used for 300 seconds. The experimental network sensor software reported the median of these readings every 30 seconds for the past 30 seconds. After that, it selected, via round-robin method, the next measurement interval and continues.
Results
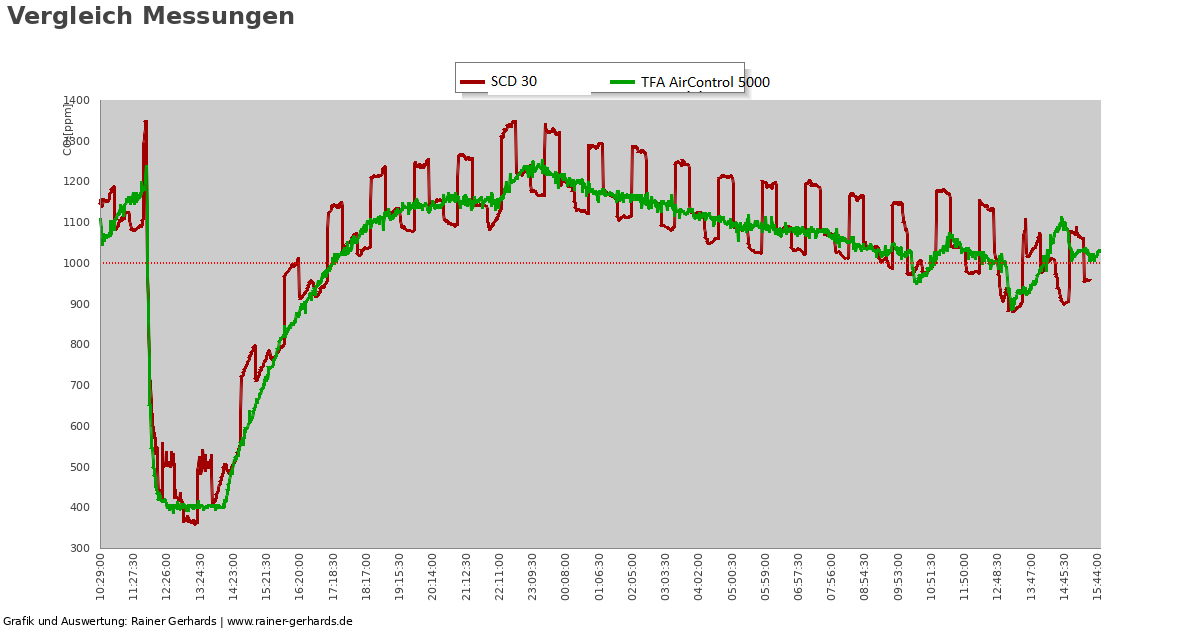
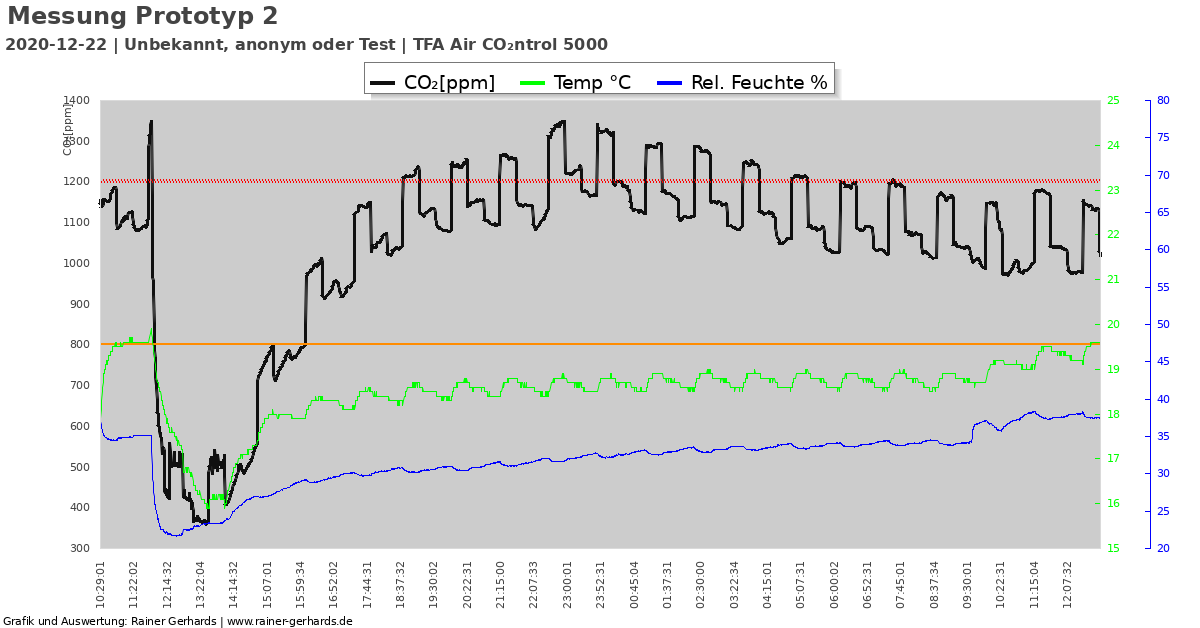
The graph on top of this page shows about a day and a half of comparison between the two devices. It shows the typical pattern: at two second interval, the SCD30 reports the highest CO2 reading. At three seconds, it reports considerably, approximately 110ppm, less. The difference when switching to five seconds is less, typically approximately 40ppm. Consequently, when going from five to two seconds again, the reading increases around 150ppm. This behavior is clearly seen in graph one on top of this page (red line). Readings at three second interval seem to correlate to reading from the TFA CO2 meter.
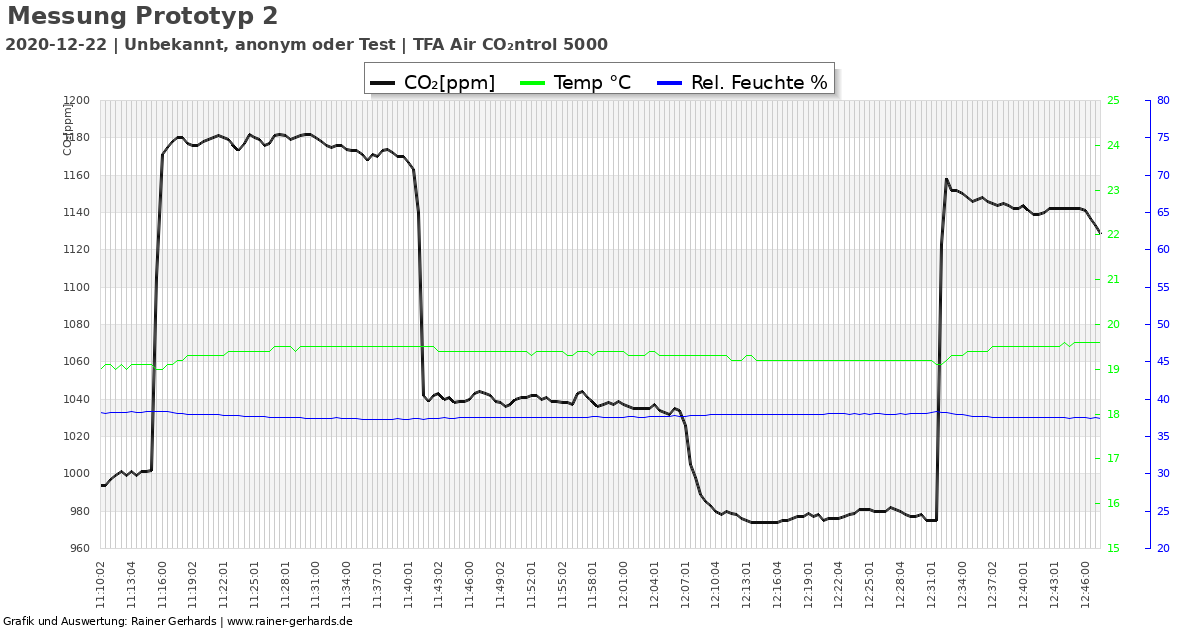
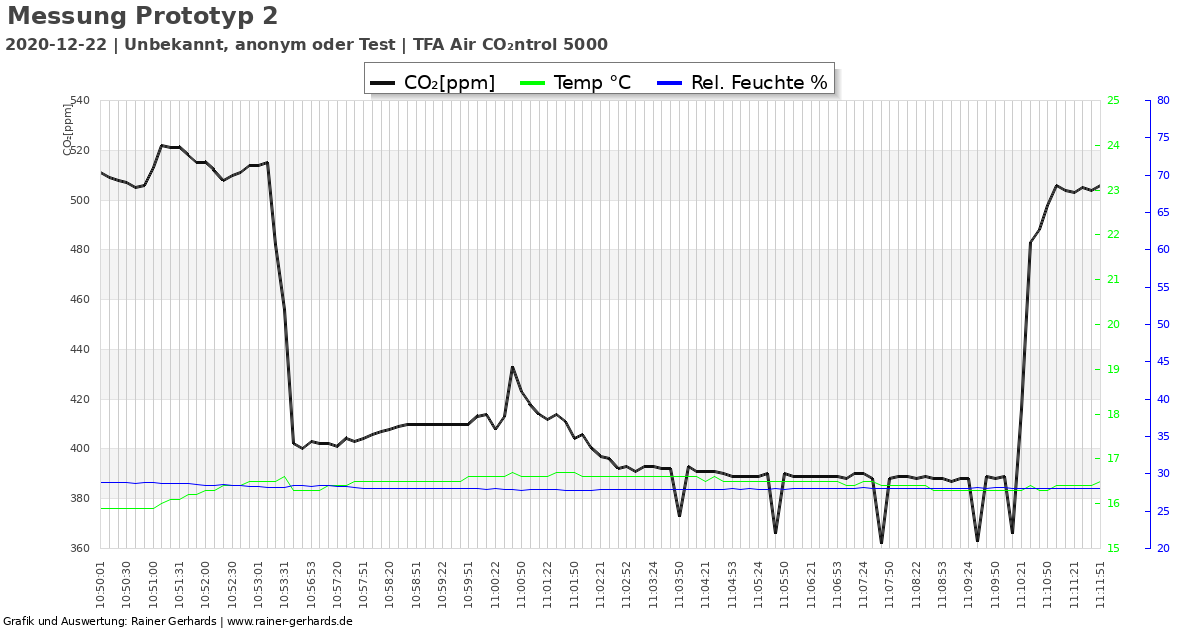
This pattern can be seen in detail if we zoom in into the plot. Here are two samples. Note that these sample were taken in a regular office space, so CO2 concentrations fluctuate a bit.
Note: the graphs state „TFA Air Con2ntrol 5000“ meter in the title. This is not correct and simply because the plotting software is not yet adapted to the SCD30-based network CO2 meter.
If one looks closely, temperature also changes with interval. At two seconds it reacheas local maximum, at five seconds local minimum. This can be explained by the fact that the NDIR sensor acts as a heat source that influences the integrated temperature sensor. Temperature changes can be seen more clearly in the following diagram.
The SCD30 is rated with an accuracy of +/-30ppm, the TFA CO2 meter with +/-50ppm (actual sensor type is unknown). We did some manual experiment with 10 seconds interval, which did not show any notable additional difference. This was expected giving that the difference from three to five seconds was far less than between two and three seconds. As such, we did not systematically experiment with measurement intervals greater than five seconds to save time.
Open Question
The question now is which reading is correct? Obviously, there is a systematic difference of around 150ppm between a two and five second measurement interval. Even more so, this seems to be consistent irrelevant of the actual amount of CO2 inside the measured gas. At low CO2 concentrations, this is a very notable loss of accuracy.
The reading at three seconds correlates very good to the TFA sensor reading. However, we do not know yet how exact the TFA sensor actually is. Due to limited resources for a volunteer project like this, we can not do comparisons to professional CO2 meters (as they are not available). We could do comparsions to a different TFA sensor and, time permitting, will try to do so.
It must also be noted that we achieved equal results with a second SCD30, albeit we could not conduct systematic testing in this case.
So far, we will settle on a three-second measurement interval. It may be wrong, but is at least consistent with the TFA meters that we also use inside our local community. We will do further comparisons with this setting applied.
Request for Comments
The main aim at documenting the behavior, however, is to request comments from other projects using the SCD30. Our project is a pure volunteer project and probably lacking a lot of knowledge. As such, we would deeply appreciate feedback from others who have more experience and insight into the matter. To do so, please leave private comments via email at rgerhards@adiscon.com or drop some notes to the comment section.
Feel free to request additional information if needed. When we receive such request, we will update this page.
Our apologies for placing this inside a German-Language site, but our understanding is that the article should be sufficiently self-contained.